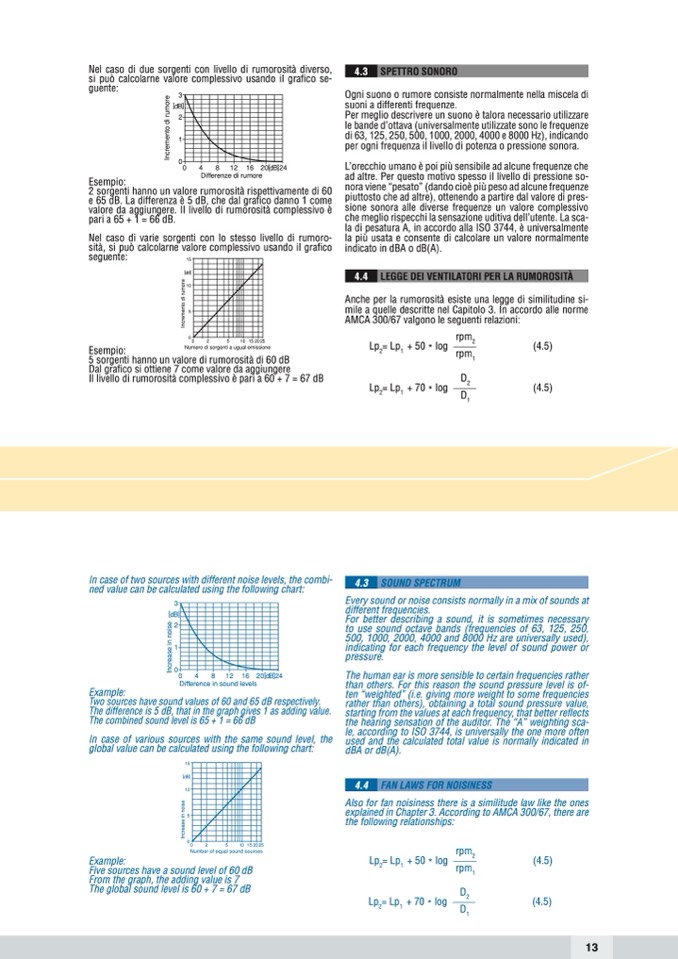
Nel caso di due sorgenti con livello di rumorosità diverso,
si può calcolarne valore complessivo usando il grafico se-
4.3
SPETTRO SONORO
guente:
3
[dB]
2
1
0
0
Ogni suono o rumore consiste normalmente nella miscela di
suoni a differenti frequenze.
Per meglio descrivere un suono è talora necessario utilizzare
le bande d’ottava (universalmente utilizzate sono le frequenze
di 63, 125, 250, 500, 1000, 2000, 4000 e 8000 Hz), indicando
per ogni frequenza il livello di potenza o pressione sonora.
L’orecchio umano è poi più sensibile ad alcune frequenze che
ad altre. Per questo motivo spesso il livello di pressione so-
nora viene “pesato” (dando cioè più peso ad alcune frequenze
piuttosto che ad altre), ottenendo a partire dal valore di pres-
sione sonora alle diverse frequenze un valore complessivo
che meglio rispecchi la sensazione uditiva dell’utente. La sca-
la di pesatura A, in accordo alla ISO 3744, è universalmente
la più usata e consente di calcolare un valore normalmente
indicato in dBA o dB(A).
Anche per la rumorosità esiste una legge di similitudine si-
mile a quelle descritte nel Capitolo 3. In accordo alle norme
AMCA 300/67 valgono le seguenti relazioni:
(4.5)
(4.5)
seguente:
8
12 16
20[dB]24
4
Differenze di rumore
Esempio:
2 sorgenti hanno un valore rumorosità rispettivamente di 60
e 65 dB. La differenza è 5 dB, che dal grafico danno 1 come
valore da aggiungere. Il livello di rumorosità complessivo è
pari a 65 + 1 = 66 dB.
Nel caso di varie sorgenti con lo stesso livello di rumoro-
sità, si può calcolarne valore complessivo usando il grafico
15
[dB]
10
5
4.4
LEGGE DEI VENTILATORI PER LA RUMOROSITÀ
0
0
2
5
Numero di sorgenti a ugual emissione
rpm
2
Esempio:
5 sorgenti hanno un valore di rumorosità di 60 dB
Dal grafico si ottiene 7 come valore da aggiungere
Il livello di rumorosità complessivo è pari a 60 + 7 = 67 dB
10 152025
Lp
2
= Lp
1
+ 50 * log
rpm
1
Lp
2
= Lp
1
+ 70 * log
D
2
D
1
In case of two sources with different noise levels, the combi-
ned value can be calculated using the following chart:
3
[dB]
2
1
Every sound or noise consists normally in a mix of sounds at
different frequencies.
For better describing a sound, it is sometimes necessary
to use sound octave bands (frequencies of 63, 125, 250,
500, 1000, 2000, 4000 and 8000 Hz are universally used),
indicating for each frequency the level of sound power or
pressure.
The human ear is more sensible to certain frequencies rather
than others. For this reason the sound pressure level is of-
ten “weighted” (i.e. giving more weight to some frequencies
rather than others), obtaining a total sound pressure value,
starting from the values at each frequency, that better reflects
the hearing sensation of the auditor. The “A” weighting sca-
le, according to ISO 3744, is universally the one more often
used and the calculated total value is normally indicated in
dBA or dB(A).
Also for fan noisiness there is a similitude law like the ones
explained in Chapter 3. According to AMCA 300/67, there are
the following relationships:
(4.5)
(4.5)
4.3
SOUND SPECTRUM
0
0
4
Difference in sound levels
Example:
Two sources have sound values of 60 and 65 dB respectively.
The difference is 5 dB, that in the graph gives 1 as adding value.
The combined sound level is 65 + 1 = 66 dB
In case of various sources with the same sound level, the
global value can be calculated using the following chart:
15
[dB]
10
5
0
8
12 16
20[dB]24
4.4
FAN LAWS FOR NOISINESS
Example:
Five sources have a sound level of 60 dB
From the graph, the adding value is 7
The global sound level is 60 + 7 = 67 dB
Lp
2
= Lp
1
+ 50 * log
rpm
1
Lp
2
= Lp
1
+ 70 * log
D
2
D
1
0
2
5
10152025
Number of equal sound sources
rpm
2
13
I
n
c
r
e
a
s
e
i
n
n
o
i
s
e
I
n
c
r
e
m
e
n
t
o
d
i
r
u
m
o
r
e
I
n
c
r
e
a
s
e
i
n
n
o
i
s
e
I
n
c
r
e
m
e
n
t
o
d
i
r
u
m
o
r
e

