4
3
2
1
0
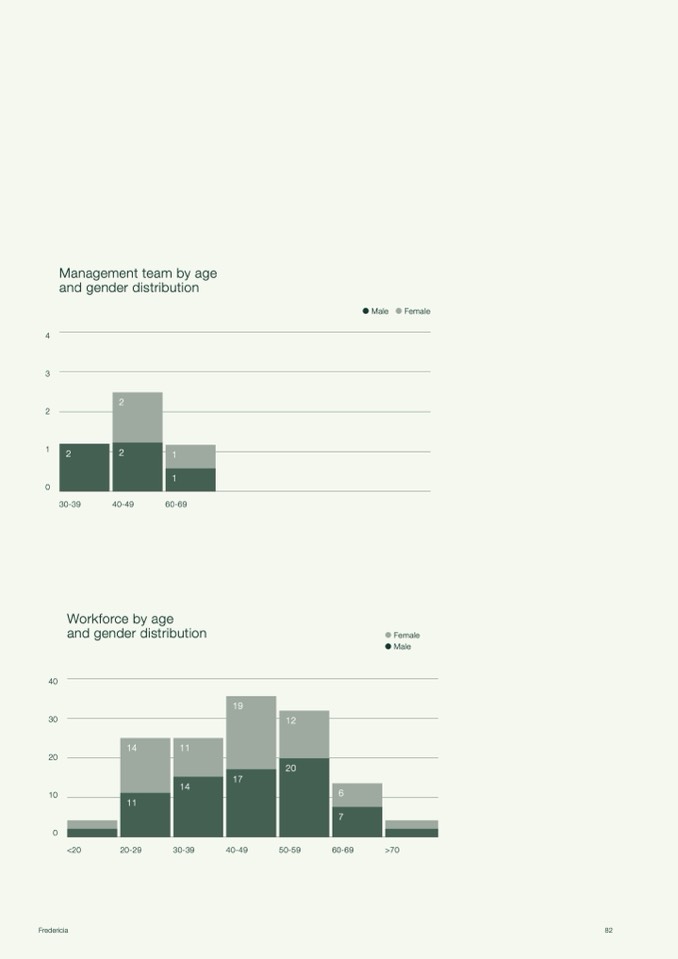
Management team by age
and gender distribution
Male
Female
40
30
20
10
0
30-39
40-49
60-69
Workforce by age
and gender distribution
Female
Male
14
11
19
12
20
11
17
14
6
7
Fredericia
82
2
<20
20-29
30-39
40-49
50-59
60-69
>70
2
2
1
1


4
3
2
1
0
Male
Female
40
30
20
10
0
30-39
40-49
60-69
Female
Male
14
11
19
12
20
11
17
14
6
7
Fredericia
82
2
<20
20-29
30-39
40-49
50-59
60-69
>70
2
2
1
1