

What are the most requested products on the market?
…the products for which the professional or private individual most frequently asks informations?
What are the items that are most frequently included in quotations or orders and which perhaps should be kept in stock or for which it may be appropriate to request better commercial conditions?
Pinaxo gives you the opportunity to get significant informations on the matter on the new Trends page.
We have added a link on each company’s page that gives you immediate access to the list of products that are most searched for and consulted.
You can also see how these trends evolve over the years.
Discover the details in this very short article…
PINAXO TRENDS
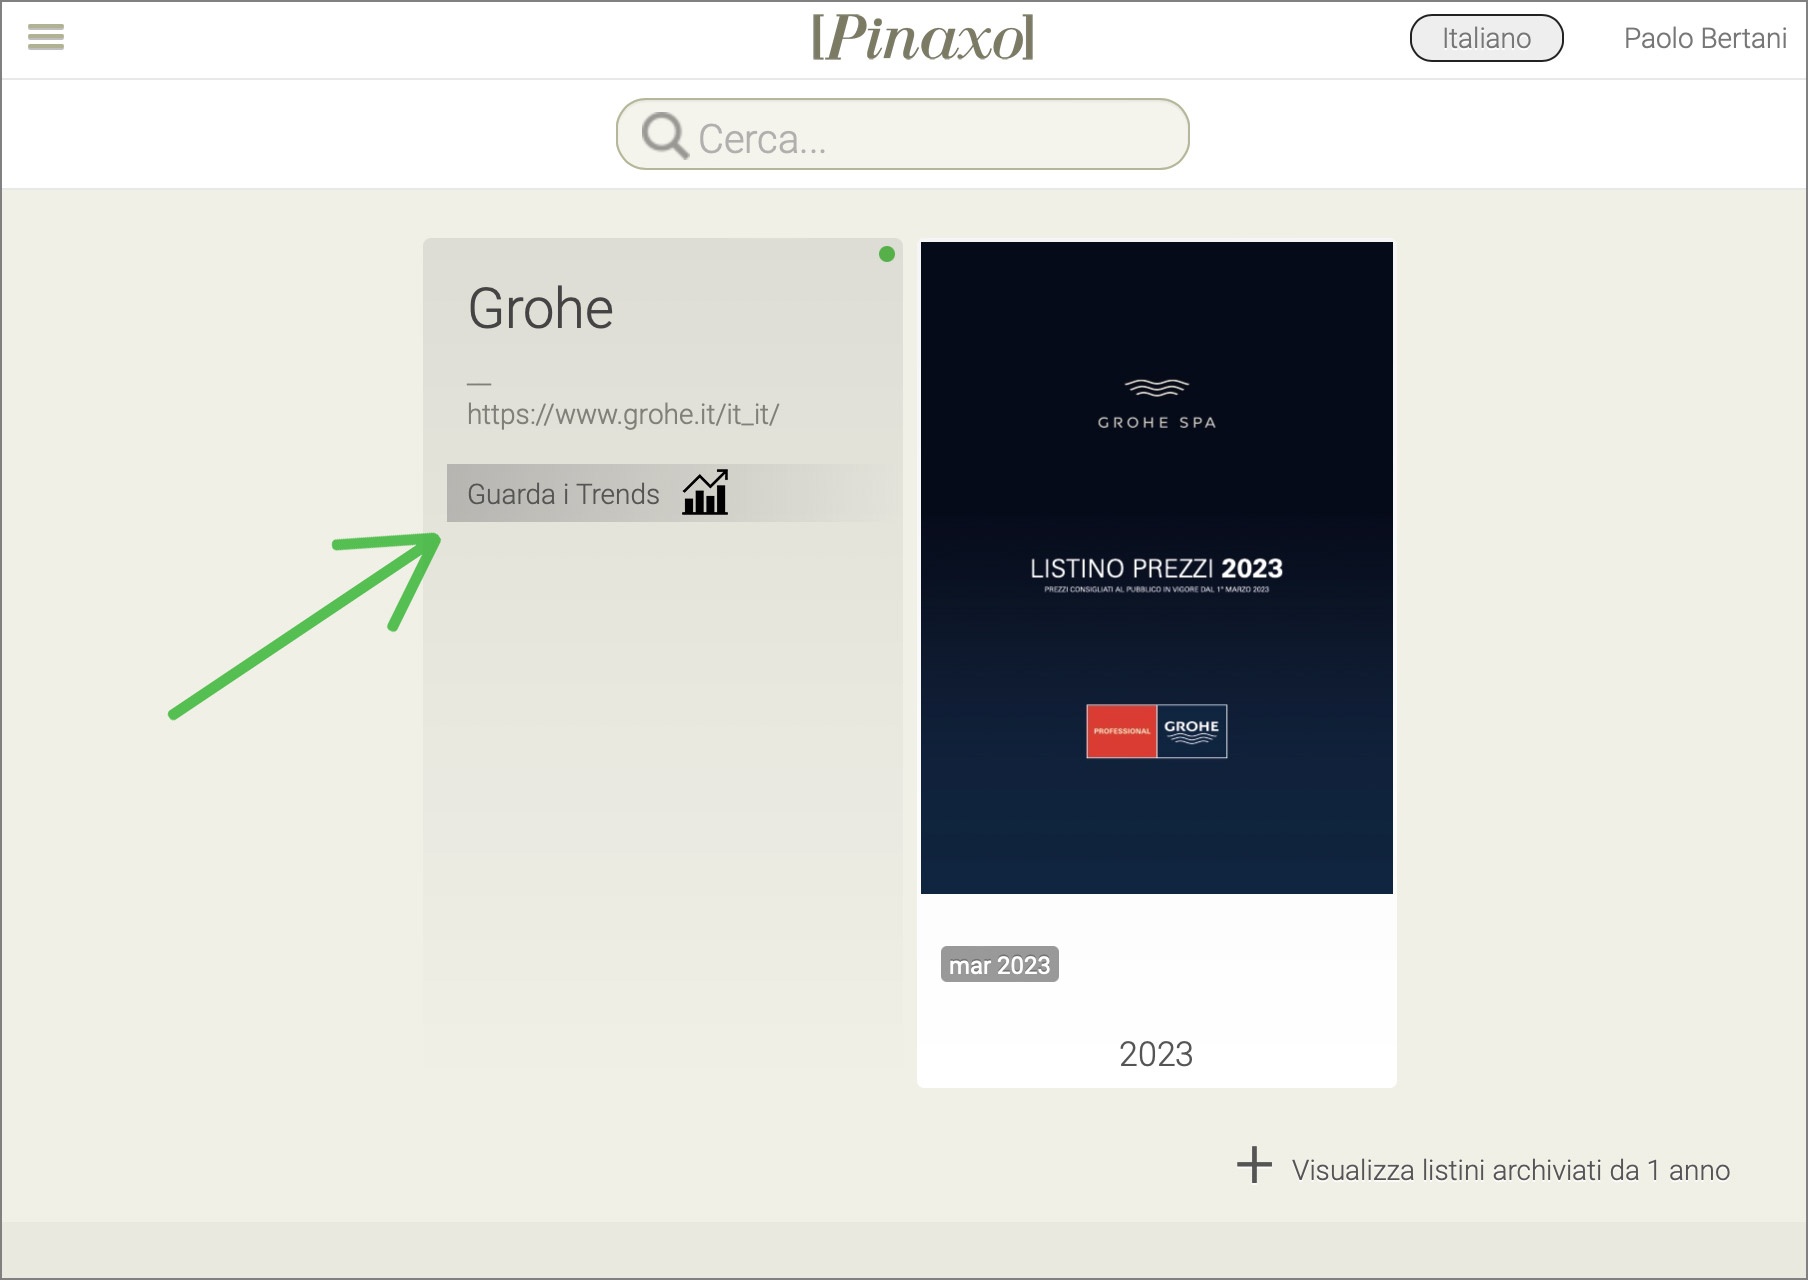
From a manufacturer’s page click on the link indicated in the image below…
The company’s Trends page opens immediately:
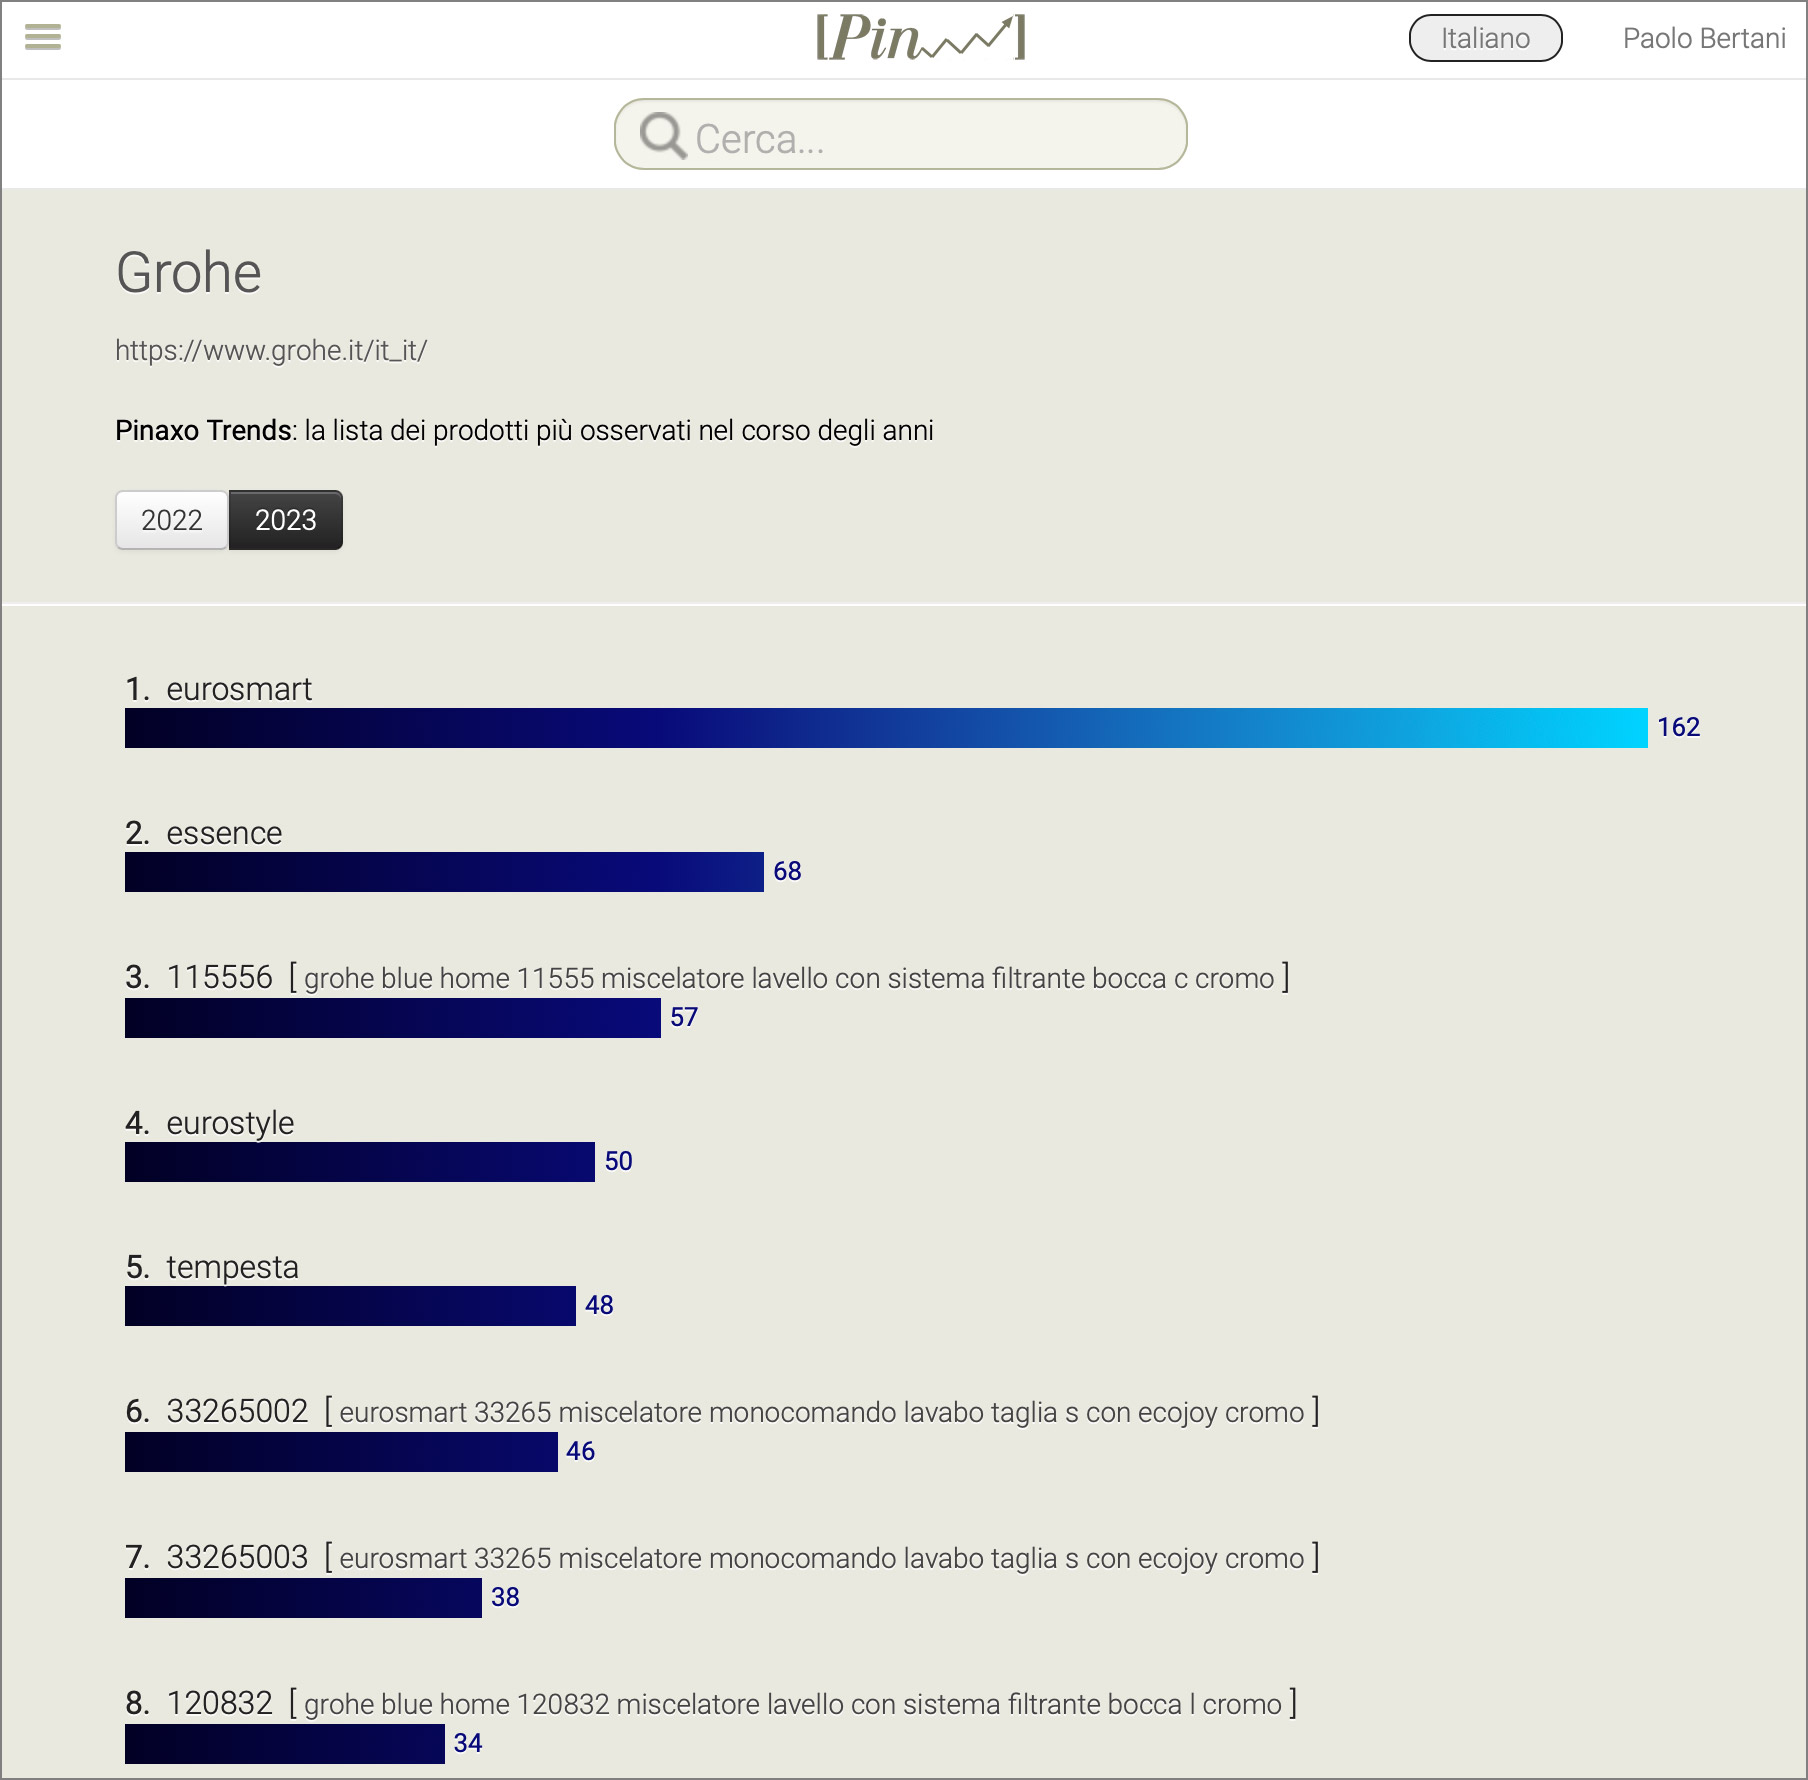
Let’s look at the various elements on the page:
You can use the search field to go to a different company’s Trends page.

If you click on the name of the manufacturer you will return to the standard page with the company’s price lists and catalogues.

Just below there is the bar on which to select the year of interest. By default the current year is selected but you can choose to view statistics for a different year and see how search and consultation trends evolve over time.

This is the list of keywords (it can be a serie’s name, a product’s name or type, an item code) in decreasing order of “interest”. If the item is a product code, the corresponding description is shown next to it.
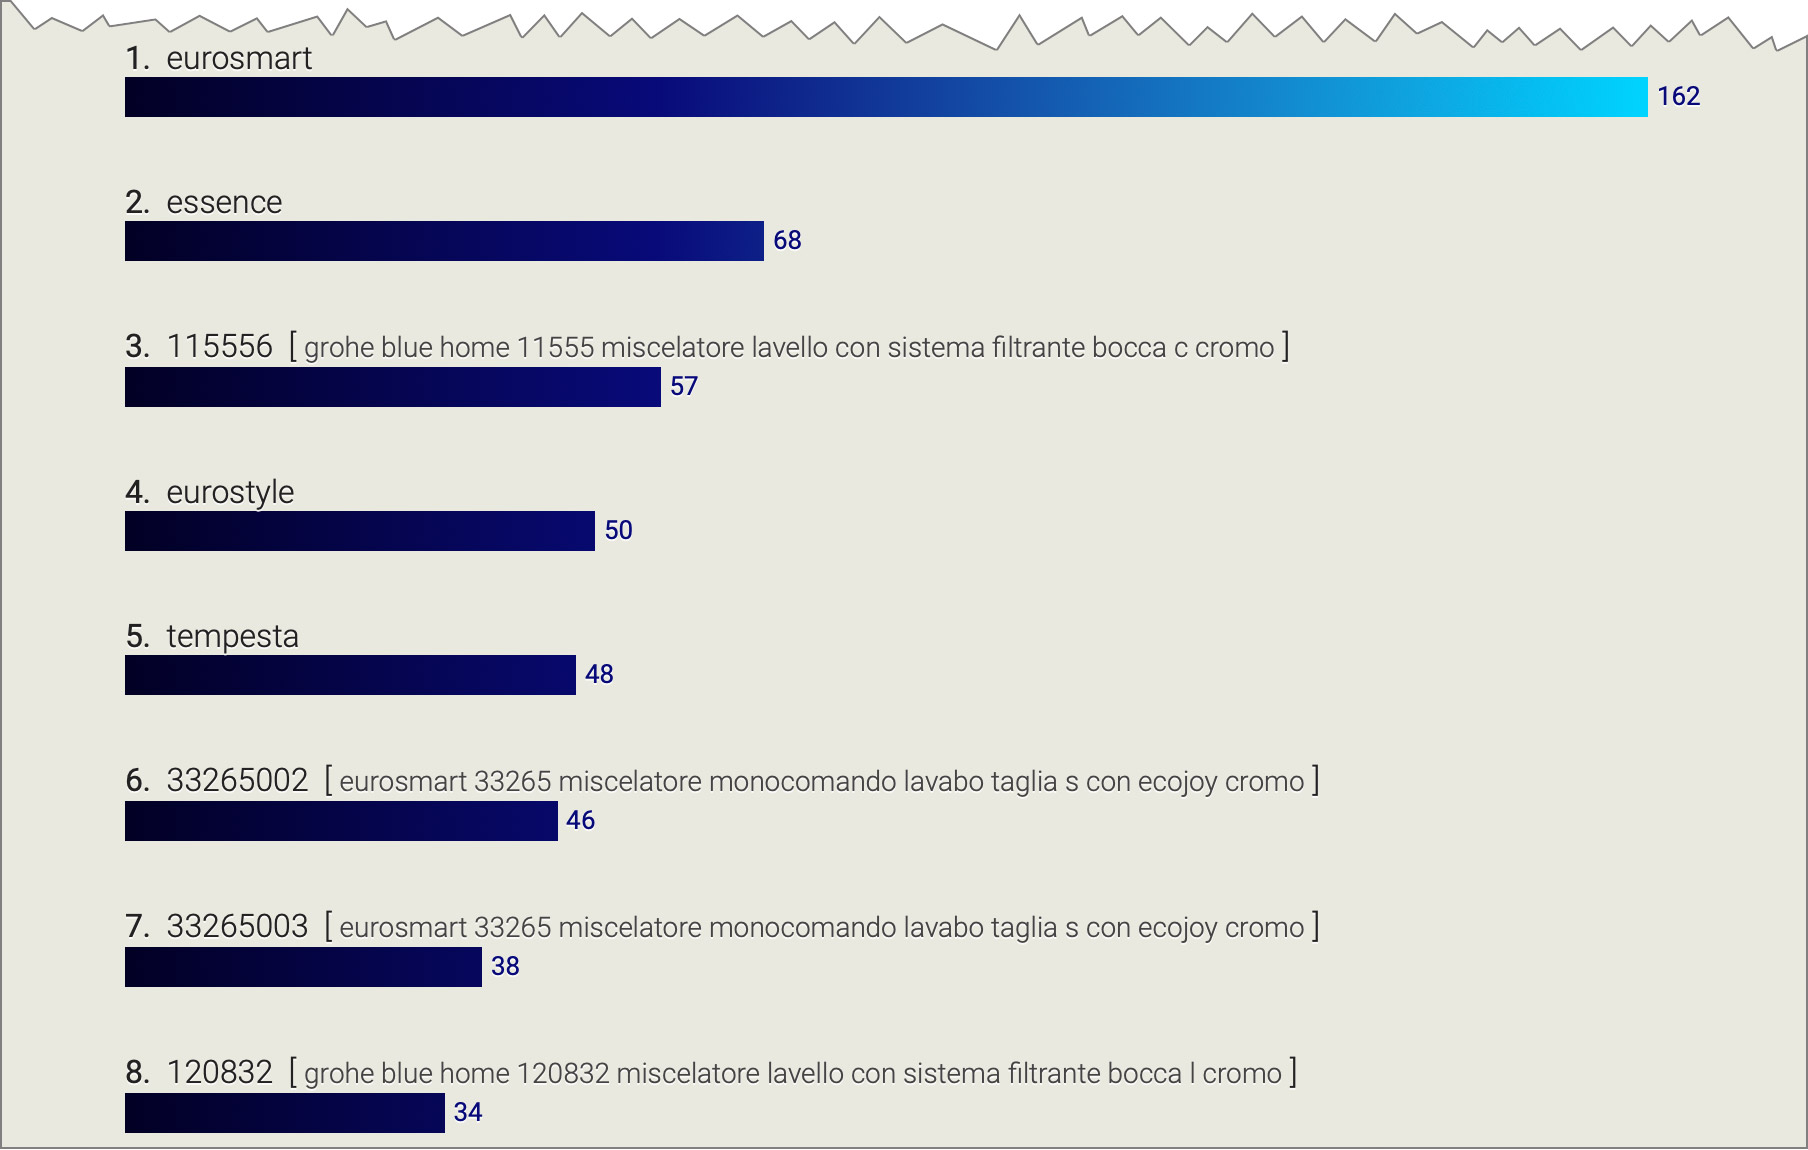
The length of each bar in the graph is proportional to the “score” shown on the right.
The score is calculated by anonymously and aggregately collecting the searches and views carried out by all users who use the Pinaxo platform.
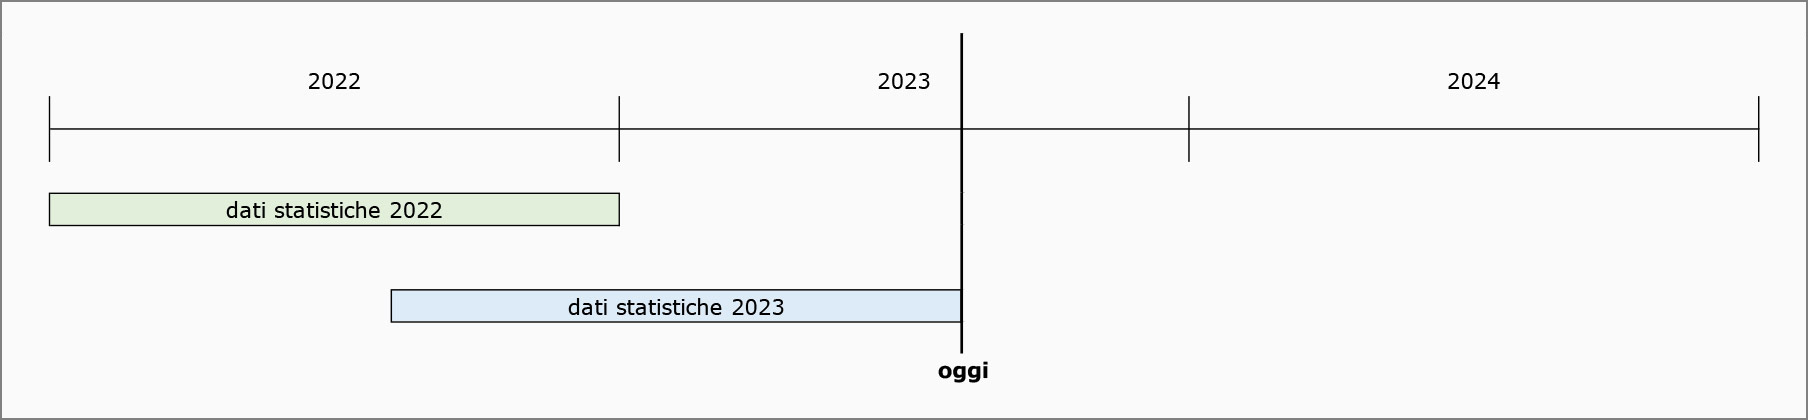
The time period relating to the selected year
If you select a year prior to the current one, the statistics are processed with data collected from January 1st to December 31st of the selected year.
However, when the current year is selected, the data used are those collected starting from the present day, including backwards the data collected in the previous 365 days.
For this reason, if, for example, we are in 2023 and it is January 15th, the 2023 graph will be almost identical to the 2022 graph, as it is generated considering the period from 01/16/2022 to 01/15/2023 (while the 2022 chart covers from 01/01/2022 to 31/12/2022, so approximately the same days).
As the time goes on (the closer we get to the end of the year) the more the graph will be obtained with different data from the previous year’s graph.
The figure below represents the concept…
What is the origin of the data used to generate Trends?
…in other words, what is the score for each keyword based on?
As previously reported, Trends is based on research and consultations carried out over time by all users of the Pinaxo online platform.
Who are they and how many are these users?
To date, our user base counts over 2,500 peoples; 95% are salespeoples and agents of companies operating in the HVAC&plumbing sector or showroom consultants/sellers.
In the remaining 5% we find mostly HVAC systems designers, architects and salespeople from companies operating in the furniture sector.
For some companies Trends is not available, why?
The indications provided by Trends are significant and “better quality” the more numerous is the data collected to generate the graphs.
If the number of searches, views, accesses of a given manufacturer are not enought to produce statistically significant data then Trends is not made available for that company.
I have some questions…
Contact us, by phone or email, we are at your disposal!
From the menu at the top left of the Pinaxo reserved area, select Contacts to get the information you need to write or call us.